Written on: February 1, 2017 by W. Stephen Tait
Hello, everyone.
Last month I began a detailed discussion on a figure that contains the risk for conventional storage corrosion tests as a function of test time and risks associated with electrochemical corrosion tests. This discussion included:
This month completes the discussion of the risks associated with corrosion tests.
Figure 1 has three types of risk data: a corrosion storage test risk-versus-time curve for traditional metal aerosol containers and the two correlations between corrosion predictions from electrochemical data and the corresponding actual commercial spray package data for all types of spray packages. The correlations are the square and diamond shapes in Figure 1.
The data in Figure 1 are empirical probabilities calculated from actual corrosion data. Empirical probabilities are different from the corresponding statistical probabilities calculated from the theoretical normal distribution. Empirical corrosion-correlations generated with a large number of data are often closer estimations for actual corrosion than the corresponding statistical probabilities.
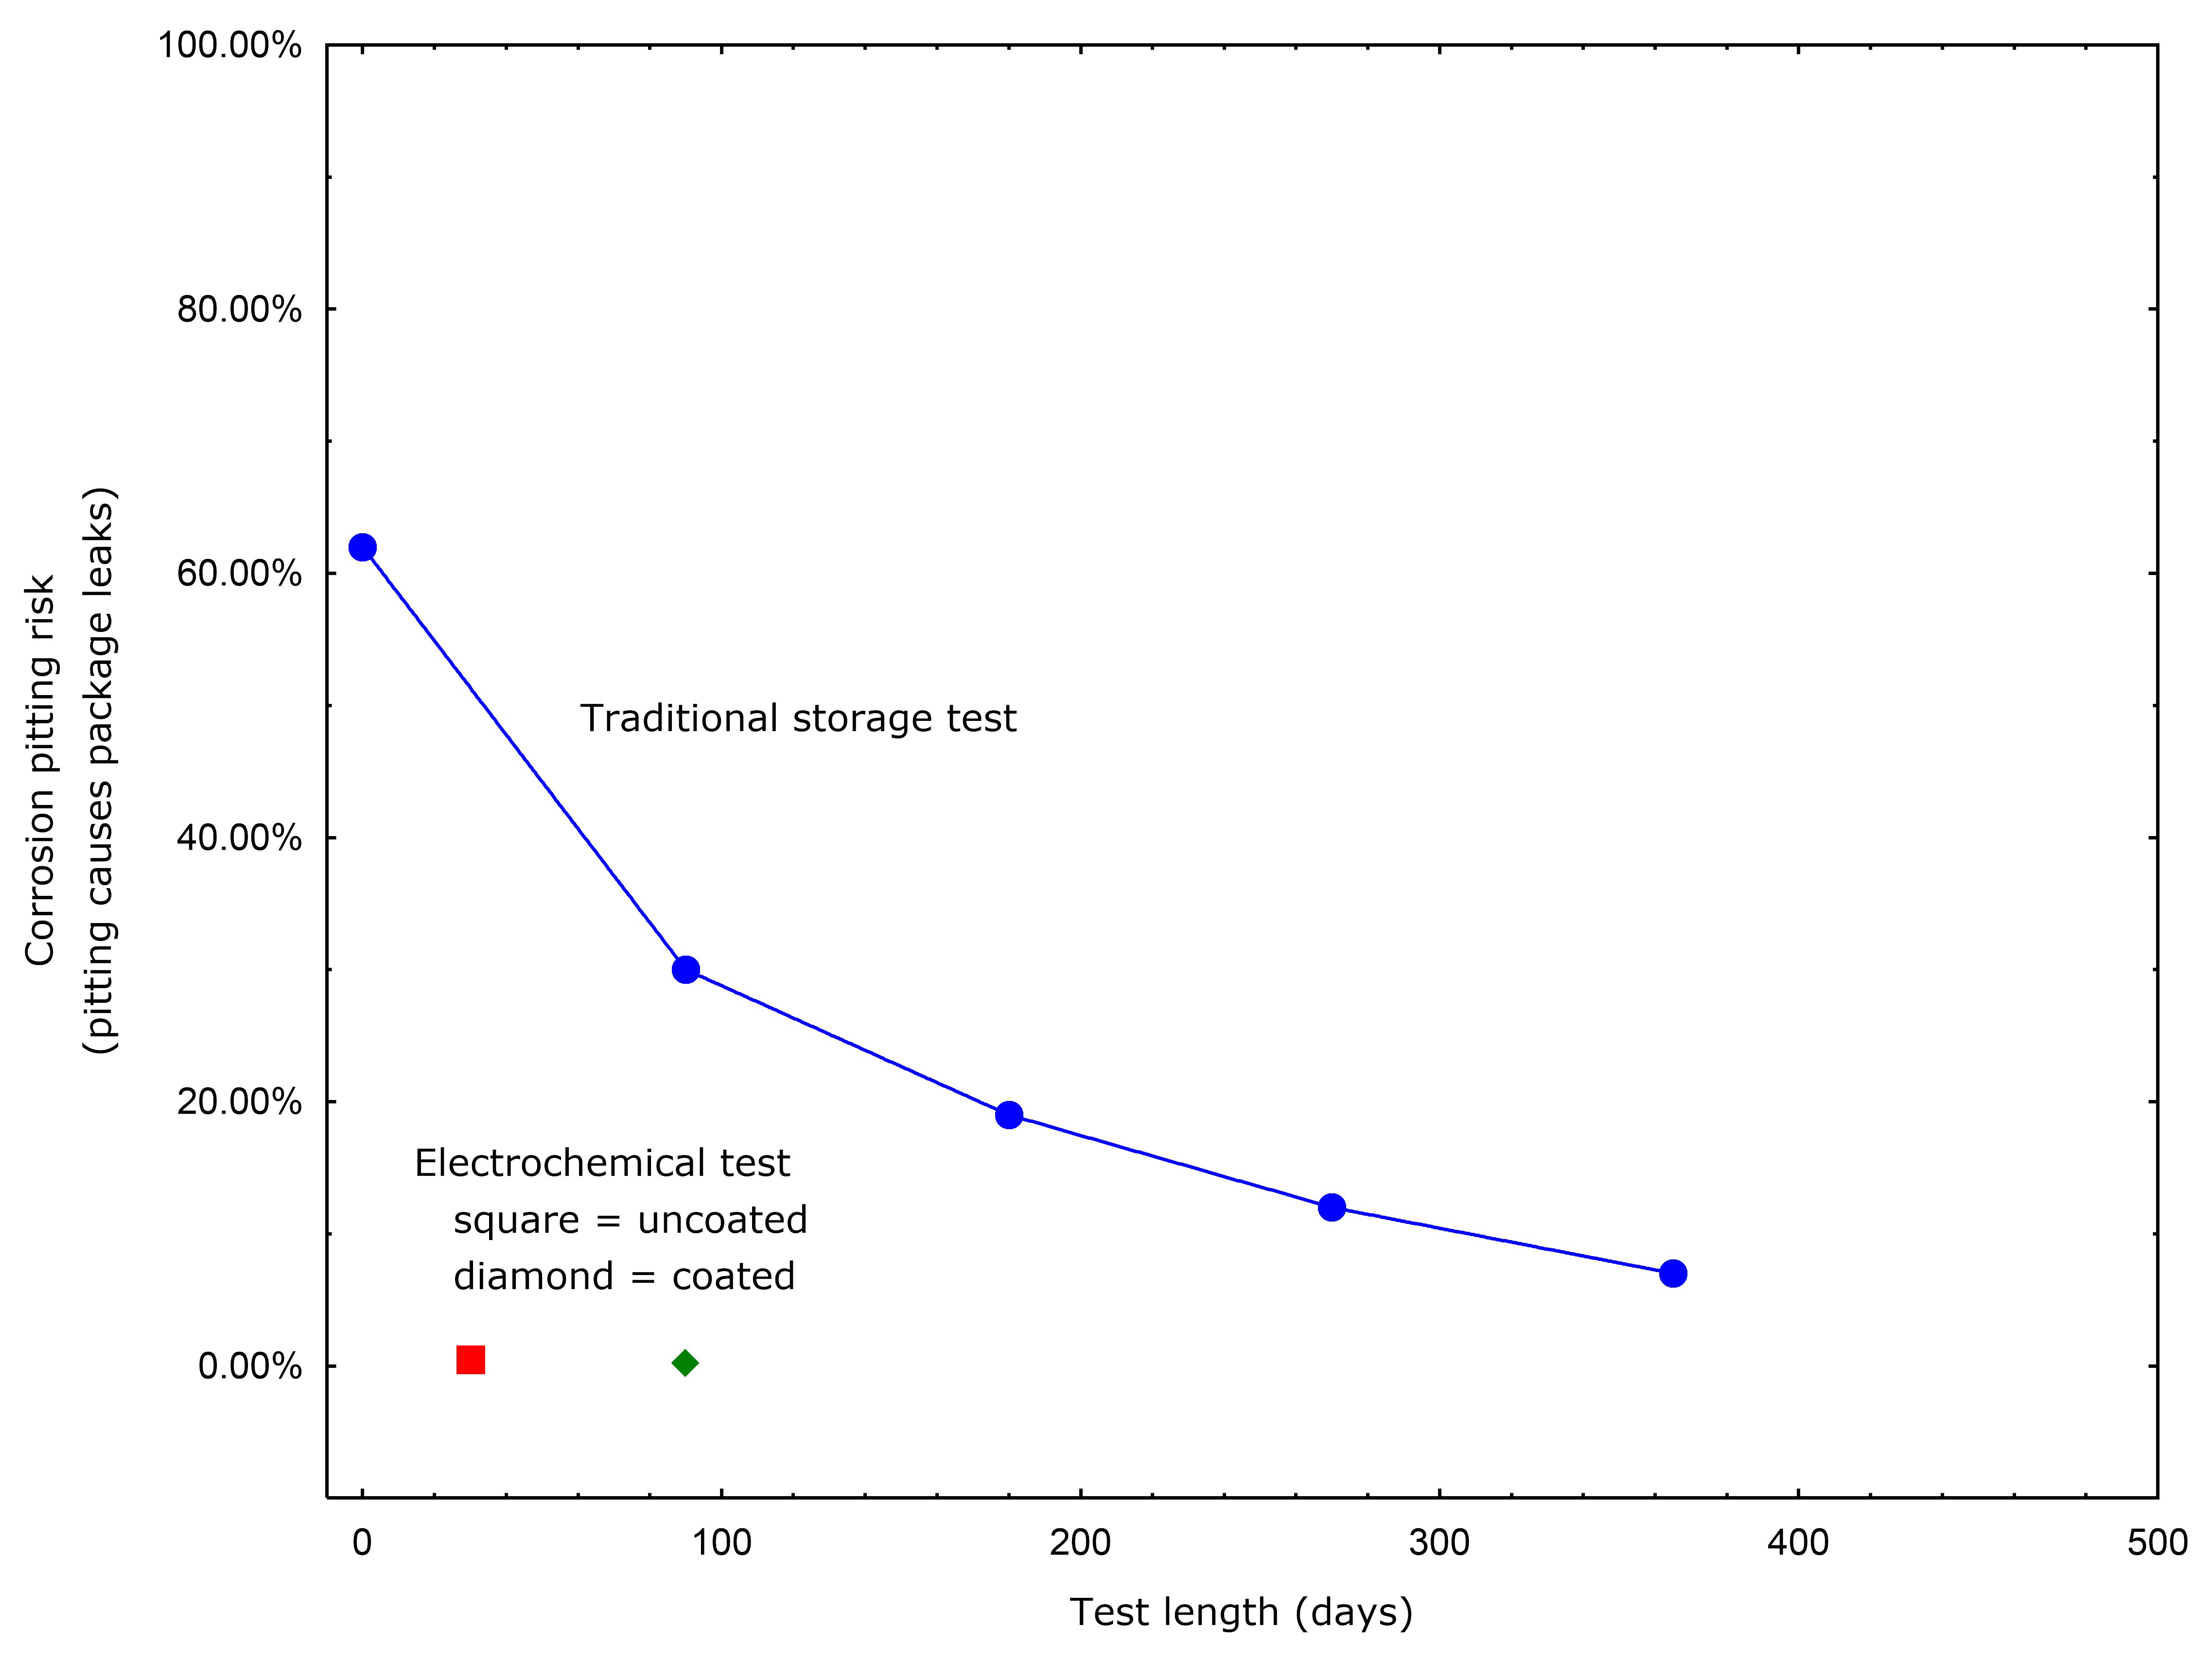
Figure 1: The estimated risk of localized corrosion as a function of test length.
The curve and correlations in Figure 1 are aggregates that only provide the generic risks for spray packaging localized corrosion (e.g., metal pitting and coating blisters). Consequently, the information in Figure 1 is useful for estimating corrosion risks for new products and derivative products (line extensions) when similar information is not available for your specific product-package systems.
So how does one read Figure 1? Let’s start with the curve for storage corrosion tests. I’ll provide examples for a) no data (zero test length), b) after three months of storage testing and c) after one year of storage testing. The estimated risks for these three times are:
Thus, Figure 1 illustrates that the corrosion risk decreases as the storage test length increases. Figure 1 also illustrates that an approximately 7% risk is obtained after one year of storage testing.
A word of caution about Figure 1 for storage tests: the risk curve is only valid for a correctly designed storage test. For example, using higher temperatures to accelerate package material corrosion is technically invalid and the risk curve in Figure 1 cannot be used for this situation. In other words, a storage test conducted for only three months at 40°C is not equivalent to six months of room temperature testing (20°C); the risk for the higher temperature data has the same risk after three months of testing.
In addition, examining one or two package samples for corrosion has an approximately 0% statistical confidence (~100% statistical risk) and examining three packages has an approximately 55% statistical confidence (~45% statistical risk). Consequently, examining a low number of packages after a short exposure time at a higher temperature has a high corrosion risk.
Let’s move on and discuss the correlations for electrochemical corrosion tests. Notice in Figure 1 that the corrosion risk for electrochemical tests reaches its lowest magnitude after 30 days of testing on uncoated spray packages and 90 days of testing on coated and laminated spray packages. Notice also that the risk with electrochemical testing is less than 1% (or greater than 99% confidence) for both types of electrochemical tests.
A word-of-caution about Figure 1 for electrochemical tests: the two correlations were generated with specific test protocols and instruments. Thus, the correlations (risks) in Figure 1 are not valid for all electrochemical corrosion test protocols and instruments. Consequently, data from other instruments and test protocols could have significantly higher risks than those in Figure 1.
In summary, Figure 1 illustrates that:
We would be happy to teach our Elements of Spray Package (Aerosol Container) Corrosion short course, which provides a more comprehensive discussion on spray package corrosion science and technology, corrosion prevention and control, at your R&D facility. We have also introduced the Corrosion Partnership Program, which makes our electrochemical corrosion laboratory, corrosion consulting and anti-corrosion technology conveniently available for your R&D program. Contact: rustdr@pairodocspro.com; 608-831-2076; www.pairodocspro.com. Back articles of Corrosion Corner are available from Spray. Thanks for your interest and I’ll see you in March.